
From data chaos to structured decision-making, ICE...
Designed for projects. Built for clarity.
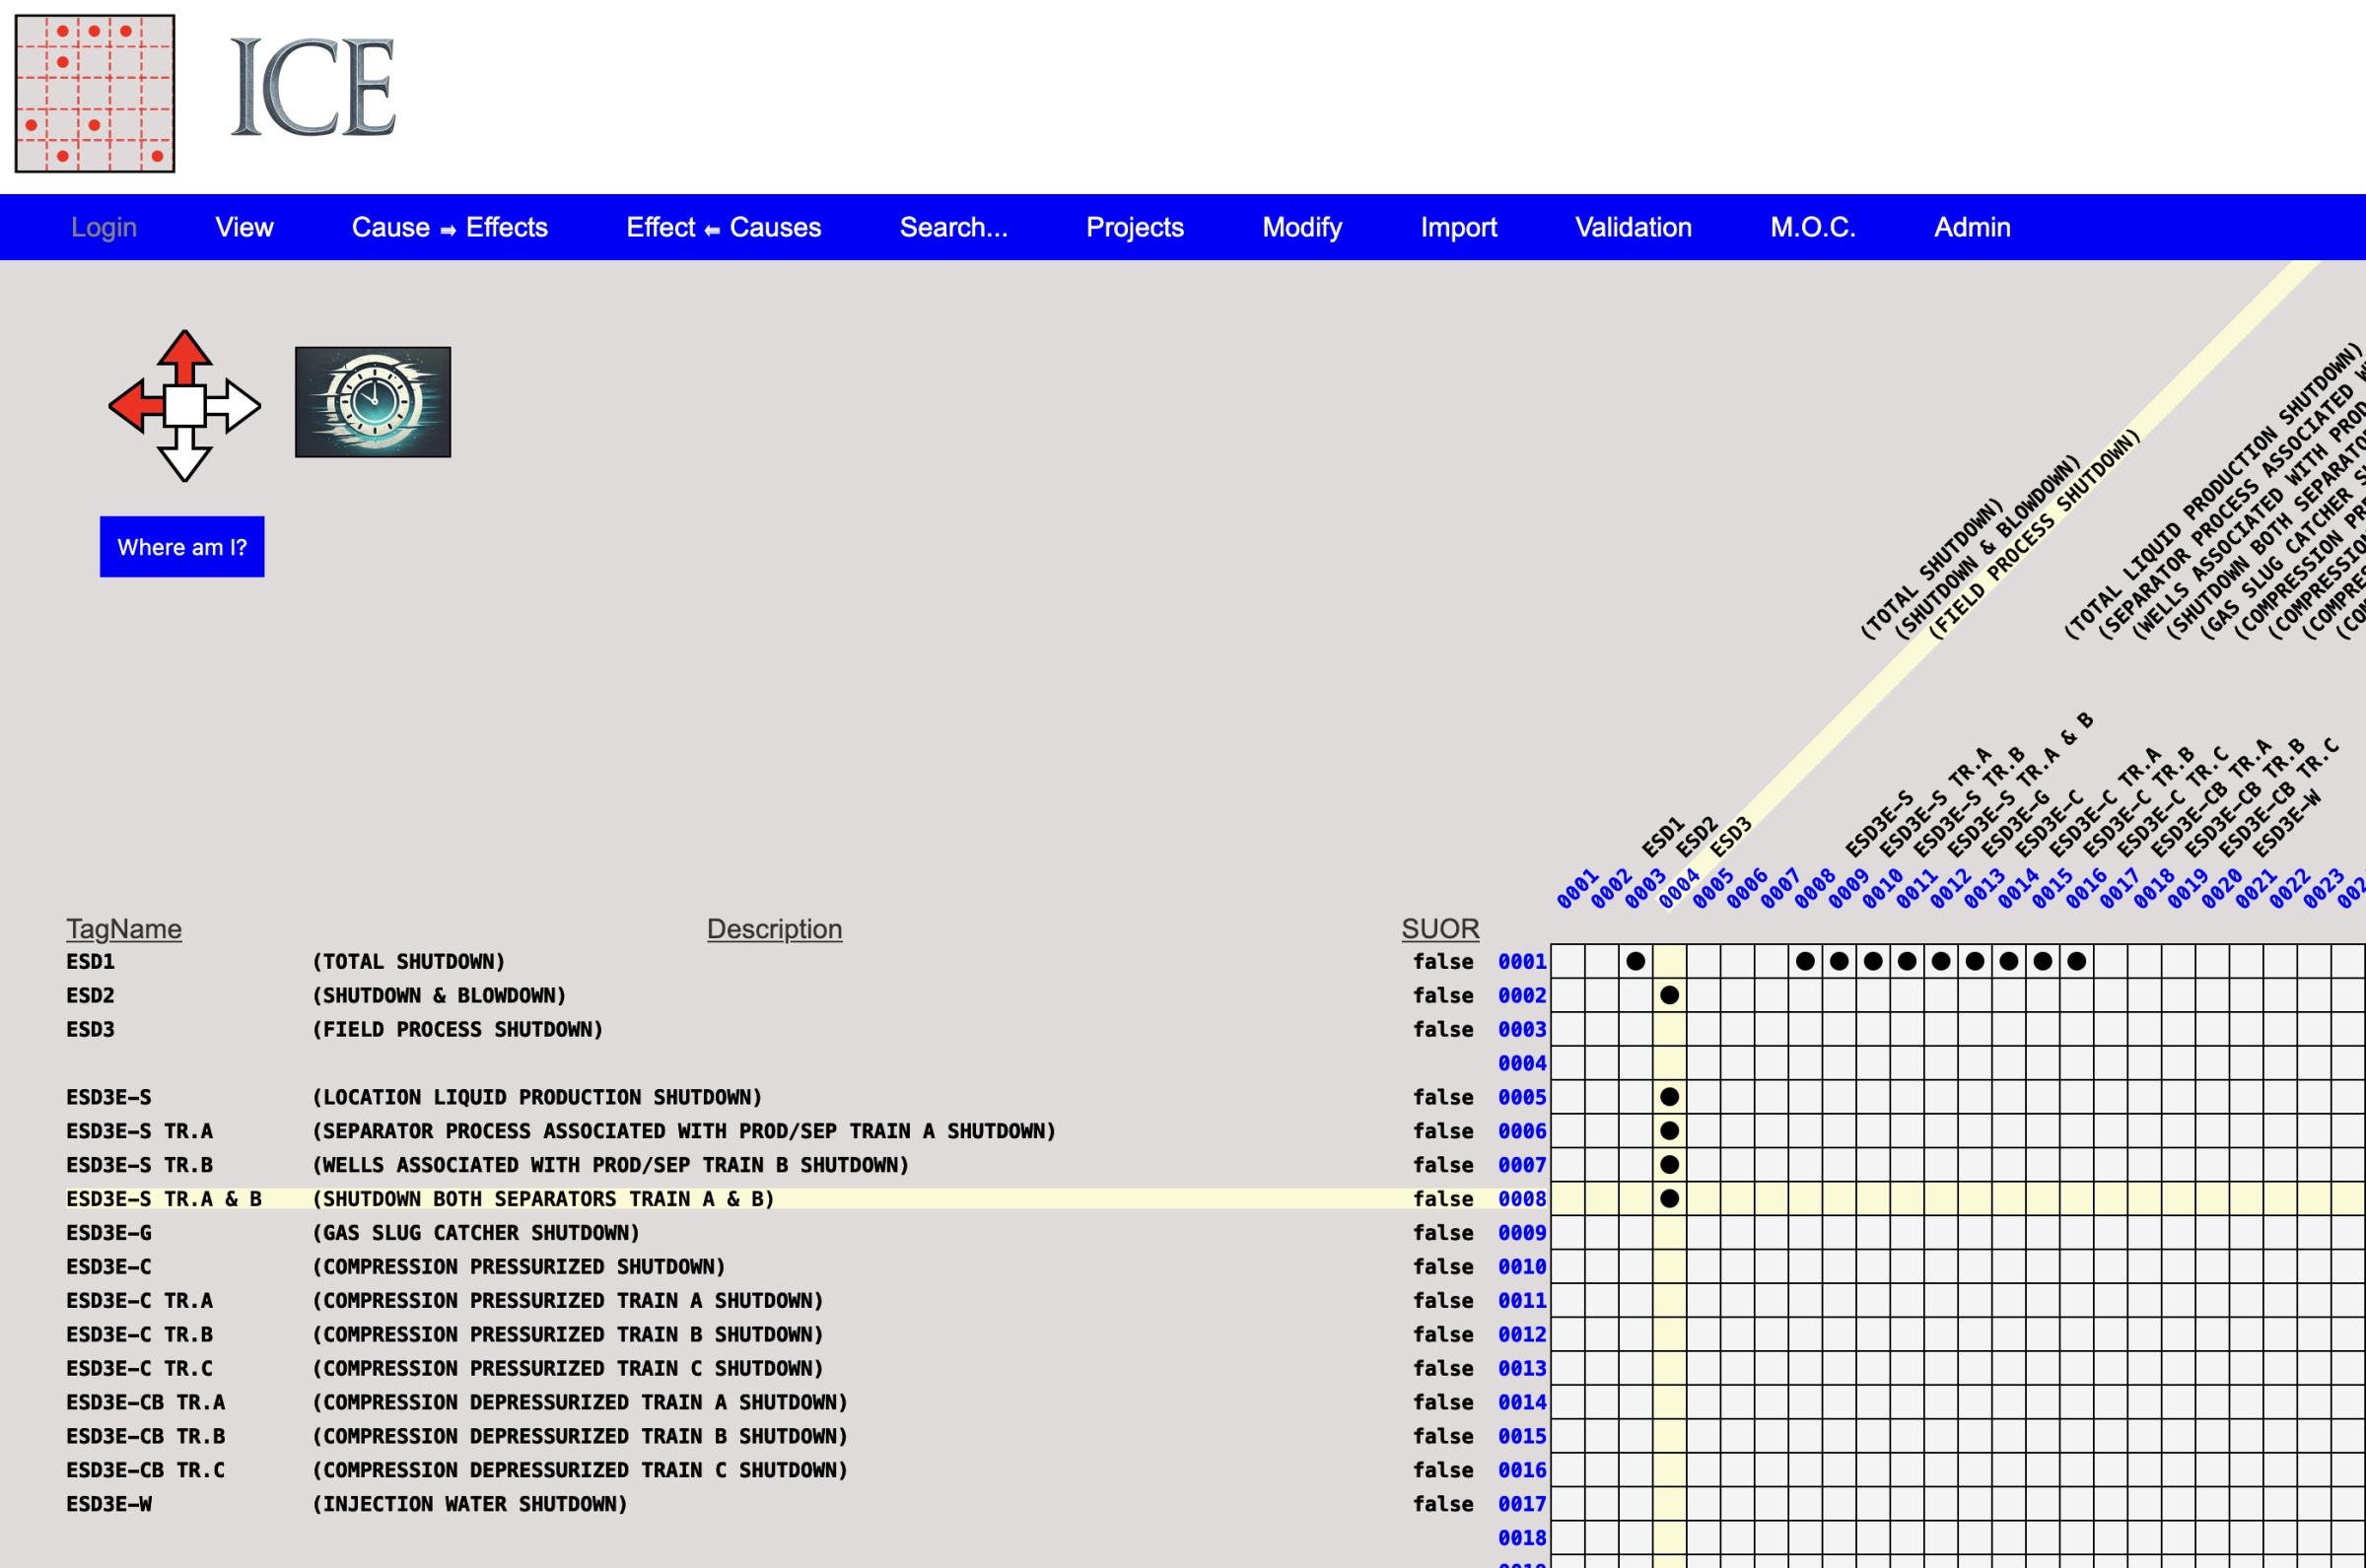
🛠️ ICE is a powerful tool designed to manage complex cause and effect matrices. Traditional matrices are typically produced on paper and can span hundreds of sheets, making them difficult to read, search, and analyze efficiently.
🧭 Unlike paper-based versions, ICE offers Time Navigation, enabling you to roll back through the matrix using a calendar view and visualize the state of any selected section at a specific point in time.
📋 By retaining all previous versions, ICE supports auditability and provides comprehensive change tracking.
🔎 The advanced search capability enables you to efficiently retrieve all effects triggered by a known cause, identify all potential causes that can lead to a specific effect, and locate any individual cause or effect within the matrix.
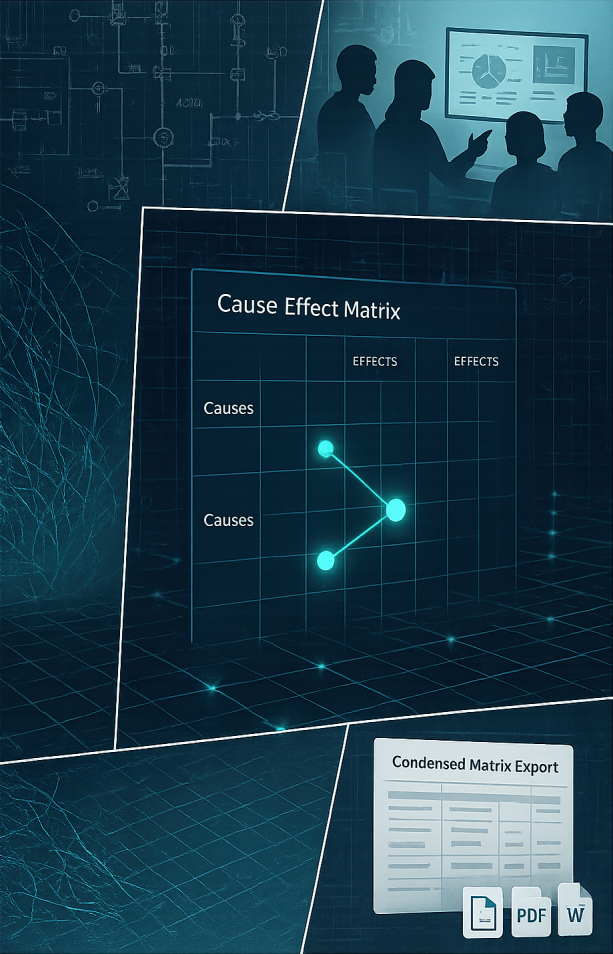
🧩 Since I.C.E. is a project-oriented Cause and Effect matrix management tool, it allows you to create condensed matrices that can be easily shared with your project team. These can be exported in formats such as matrix view or CSV, making them compatible with software like Microsoft Excel or Word. This functionality supports the production of clear, well-structured documentation throughout your project lifecycle and facilitates collaboration across all relevant departments and services.
⚙️ Throughout your project, I.C.E. offers the flexibility to validate every modification made to the matrix through a structured validation process.
🗂️ Each change passes through clearly defined stages, including: Modified, Implemented, To Be Added, To Be Removed, Additional Point Validated, Deletion Validated, Modification Validated, or Rejected.
🛢️ Every change is recorded in a dedicated database, capturing the date of the modification, the author, its current status, and the associated project reference.
💾 Once a change is implemented, it is transferred to the As-Built database. This ensures full traceability, allowing you to track the complete lifecycle of each point in the matrix — even those that have been deleted.
Additional Features:
-
Interactive Matrix Overview: Visualize the entire matrix at a glance using a grid of pages. Each page represents a 40-causes x 50-effects section, color-coded (grey = empty, white = contains relations). Click any page to instantly navigate to that part of the matrix.
-
Custom Matrix Generator: Select specific causes and effects to create a focused, compact version of the matrix. Add a custom note, print the result, or export the related data as a CSV file — perfect for tailored analysis or reporting.
Get in Touch
Prod-Solution d.o.o.
Registration Nb: 51322191
PIB: 03771415
📩 support@prod-solution.com
📞 +382 683 683 82
🏠 Kalimanska I BB
Tivat
MONTENEGRO
